テンプレートコミュニティ /
Scatter Plot of Strong Positive Correlation
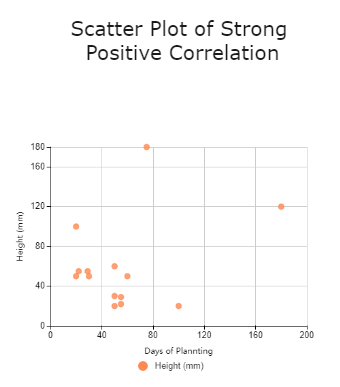
Scatter Plot of Strong Positive Correlation
Joy
に公開されました 2021-09-22
AIでダイアグラムを生成
テンプレート
デスクトップ版
A scatter plot is a type of mathematical diagram that uses Cartesian coordinates to display values for typically two variables for a set of data. To show a strong positive correlation, the value of Y increases as the value of X increases.
Tag
scatter graph
シェア
コメントを追加
投稿
おすすめ
テンプレート
読み込み中
Close
Close


 デスクトップ版