Make an Area Chart Step by Step
Part 1: What is an Area Chart?
An area chart is used to show how data values change over a period of time. Data points are plotted and connected with a line running through them. The area between the horizontal axis and the line is then shaded or colored in.
Area charts are useful for identifying trends over time. For example, they might be used by teachers to track a student's progress over the course of a year. As a large area of the chart is colored in, the exact value of the data point at a given time may not be entirely obvious at first glance, so it is best used for purely identifying trends and patterns.
Part 2: How to Create an Area Chart
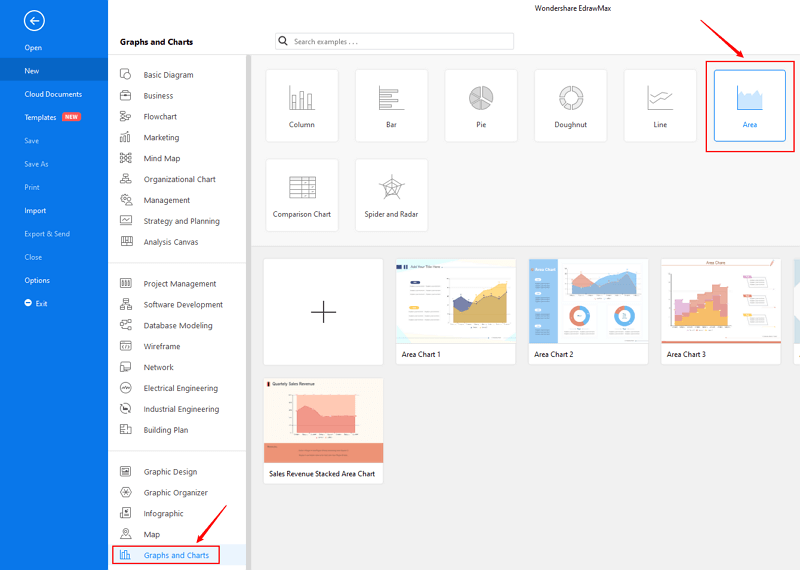
Step 1: Open EdrawMax from your computer, and navigate to [New] > [Graphs and Charts] > [Area].
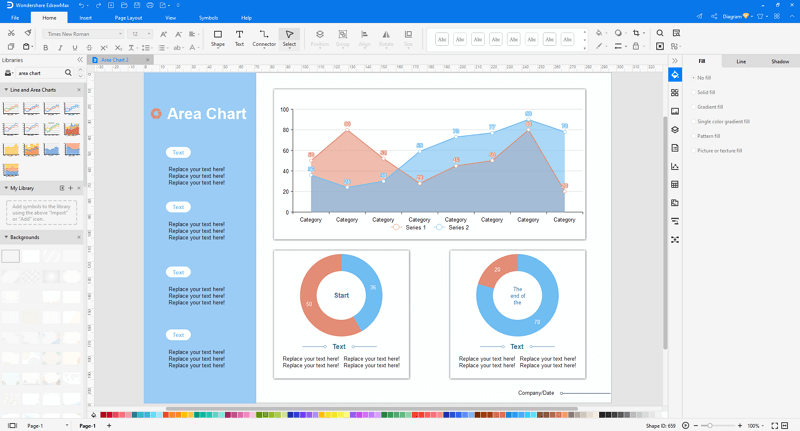
Step 2.1: Choose a pre-made template from the template gallery and open it. You will see the chart on the canvas with a lot of editing tools on the top menus and right panes.
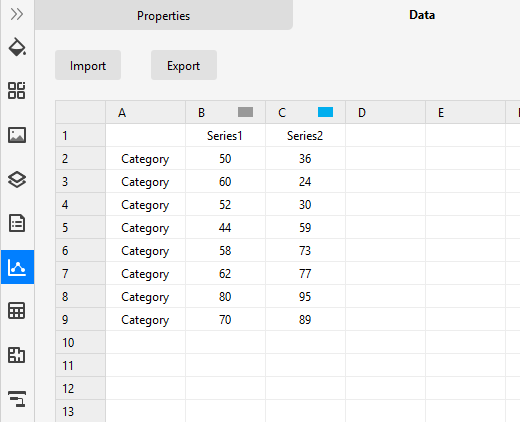
Step 2.2: After you open a blank area chart template or insert one on the canvas, you can import the data by uploading files (XLSX or CSV) or pasting the data on the windows.
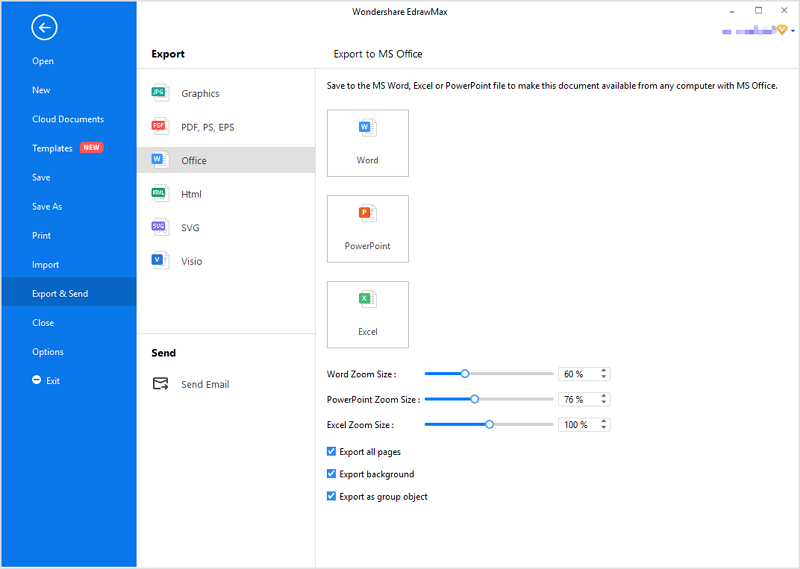
Step 3: When the column chart is finished, you are able to save and export the creation to graphics(JPG, PNG), PDF, editable MS Office file format, SVG and Visio vsdx file format.
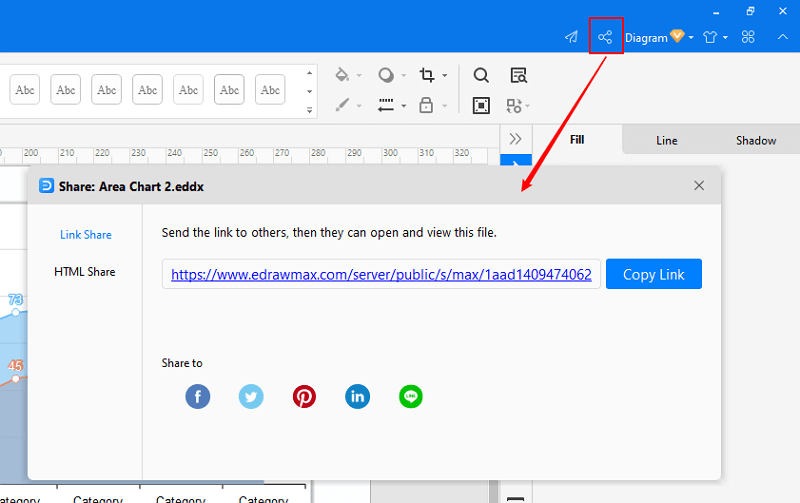
Step 4: Alternatively, you can share the chart via social media and sharing links. In addition, you can publish your diagram into EdrawMax's online template gallery.
EdrawMax
All-in-One Diagram Software
- Superior file compatibility: Import and export drawings to various file formats, such as Visio
- Cross-platform supported (Windows, Mac, Linux, Web)
Part 4: Area Chart Examples
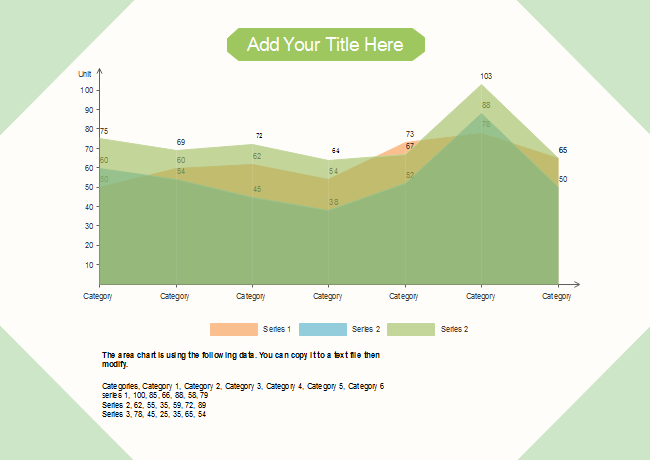
Example 1: Blank Area Chart
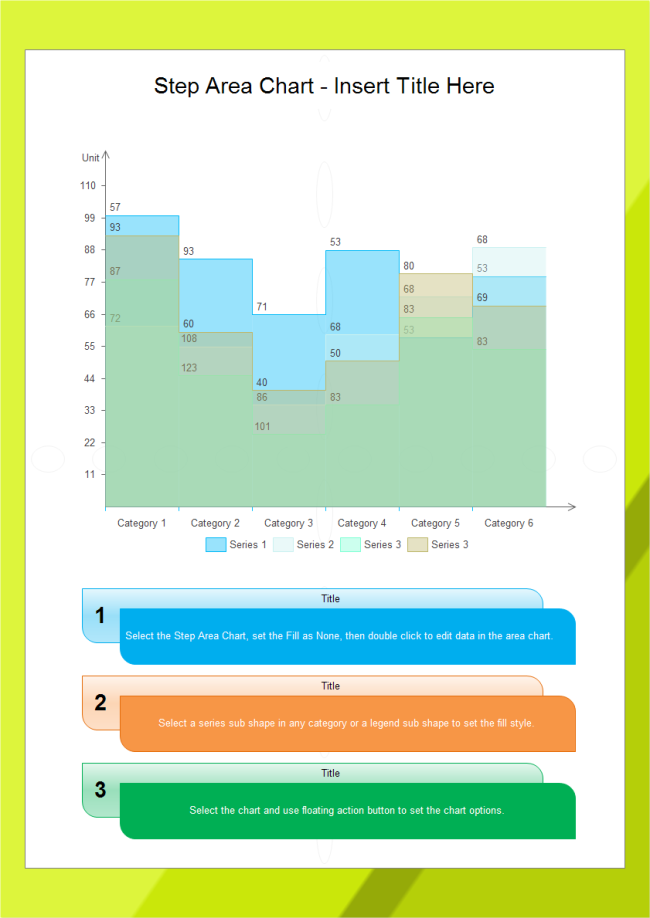
Example 2: Step Area Chart
More Related

