Introduction to Fault Tree Analysis
What FTA Is
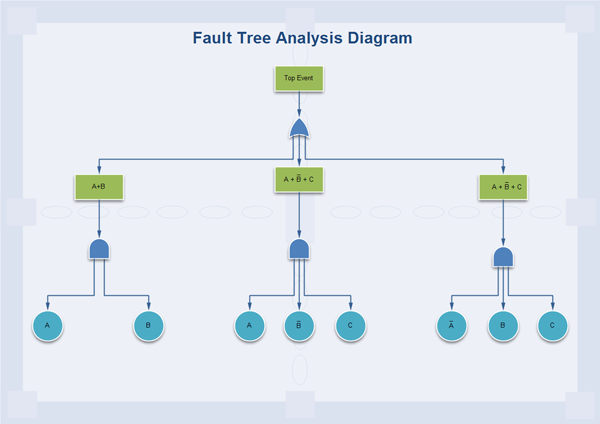
The Fault Tree Analysis (FTA) refers to a systematic, deductive (top-down type) and probabilistic risk assessment tool that shows the causal relations leading to a certain undesired event, referred to as the "Top Event" (TE). The events which cannot be subdivided are Basic Events. Fault Tree diagram shows the undesired state of the investigated system (top event) in terms of the states of its components (basic events). The Fault Tree Analysis is a graphical design technique. The main product of FTA is a diagram with a dendritic structure. Here is an example made by Edraw to help you understand FTA visually.
When to Use FTA
Fault tree analysis is useful both in designing new products/services and in dealing with identified problems in existing products/services. In the quality planning process, the analysis can be used to optimize process features and goals and to design for critical factors and human error. As part of process improvement, it can be used to help identify root causes of trouble and to design remedies and countermeasures.
Why Use FTA
The feasibility of FTA lies in its effectiveness and ease of implementation. It can bring various benefits as follows.
How to Carry out FTA
The general procedure of a fault tree analysis begins with identifying what to analyze. It mainly includes the following sub processes.
1. Select a component for analysis. Select an easy-to-use tool to diagram the analysis result such as Edraw. It is feasible for it predefined shapes and ready-made templates and examples. In Edraw, you just need to drag a box at the top of the diagram and input the component inside.
2. Identify critical failures or "faults" related to the component. Using Failure Mode and Effect Analysis is a good way to identify faults during quality planning. For quality improvement, faults
may be identified through Brainstorming or as the output of Cause and Effect Analysis.
3. Find out causes for each fault. List all applicable causes for faults below the fault. Connect the causes to the appropriate fault box. Edraw's Connector function can generate connecting lines automatically. The lines can be both straight and right-angled.
4. Work toward a root cause. Continue identifying causes for each fault until you reach a root or controllable factor (basic events).
5. Seek for countermeasures for each root cause. Finding out the causes are not the ultimate goal. The purpose of doing FTA is actually solving the problem or eliminating the fault. Use Brainstorming to develop actions to counteract the root cause of each critical failure. Click here to learn How to Create a Fault Tree.
Element of Fault Tree Analysis Diagrams
Benefits of Constructing a Fault Tree Diagram

