How to Create a Doughnut Chart
Part 1: What is a Doughnut Chart?
Doughnut charts are pie charts with an area of space in the middle. It shows the proportions of each category based on the size of each slice. The entire circle represents 100 percent, and each slice represents a portion of a whole.
Doughnut charts benefit from having a blank space in the middle in which extra information about the chart or data values can be included. In fact, the blank space can be used to display an extra set of data altogether so that comparisons between two sets of data can be made directly on the same chart.
Part 2: Types of Doughnut Charts
Doughnut charts are excellent for displaying data points as a percentage of the whole.
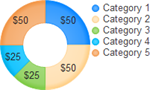
Simple Doughnut Chart: Suitable for comparing different categories.
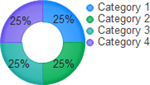
100% Doughnut Chart: Suitable for showing each item's contribution rate to the whole.
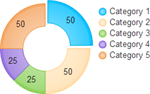
Exploded Doughnut Chart: Select a doughnut chart shape and move a segment to new position to make an explored doughnut chart.
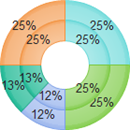
Multi-level Doughnut Chart: Unique doughnut chart with more striking appearance.
Part 3: How to Make a Doughnut Chart
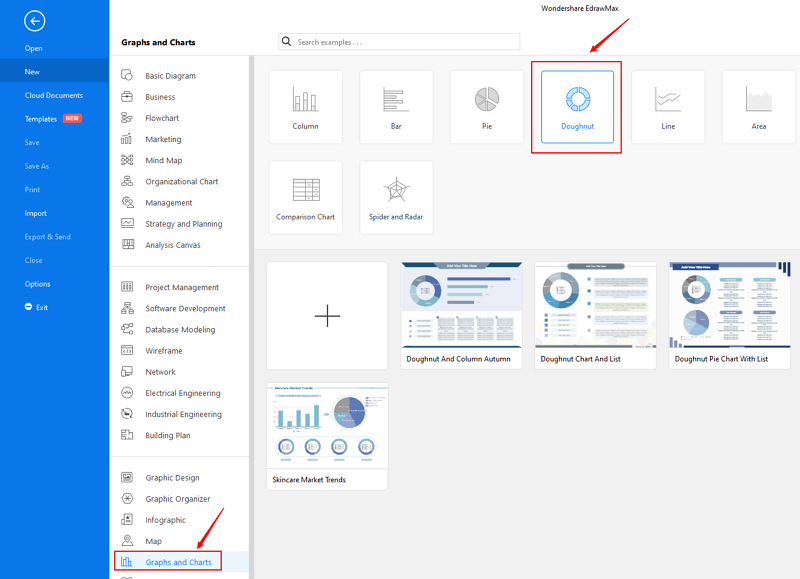
Step 1: Open EdrawMax from your computer, and navigate to [New] > [Graphs and Charts] > [Doughnut].
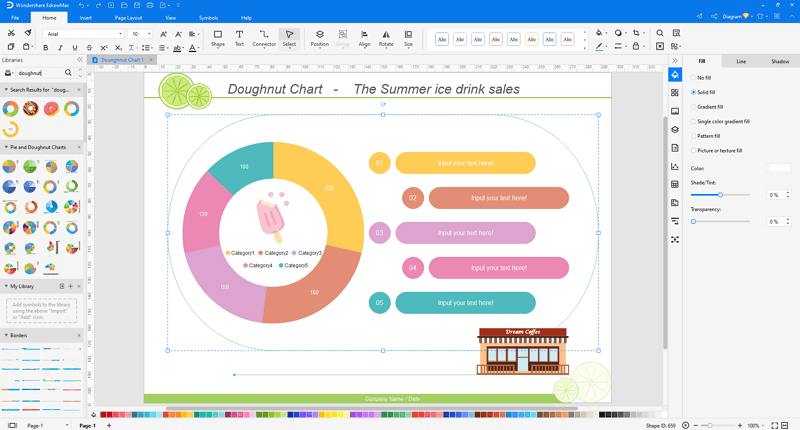
Step 2.1: Choose a pre-made template from the template gallery and open it. You will see the chart on the canvas with a lot of editing tools on the top menus and right panes.
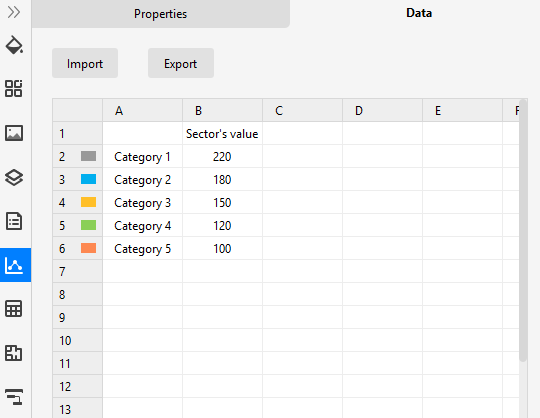
Step 2.2: After you open a blank doughnut chart template or insert one on the canvas, you can import the data by uploading files (XLSX or CSV) or pasting the data on the windows.
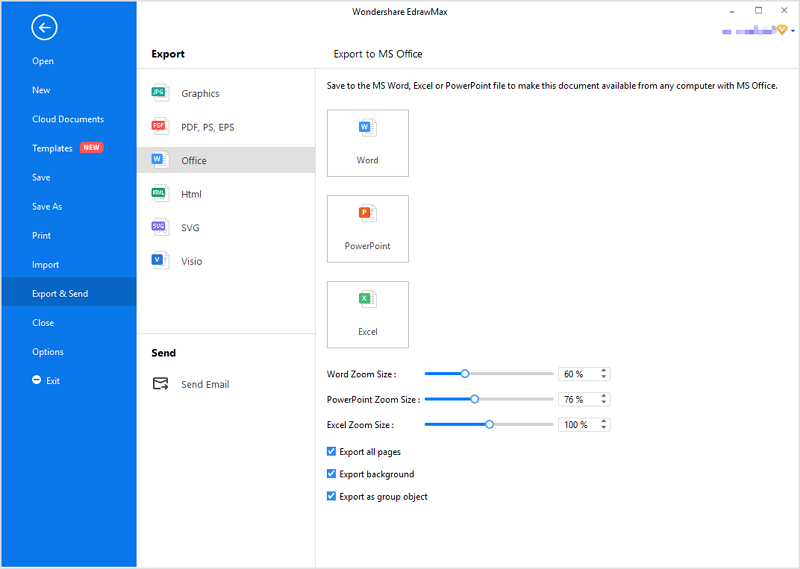
Step 3: You are able to save and export the chart to graphics(JPG, PNG), PDF, editable MS Office file format, SVG and Visio vsdx file format when you finish the design.
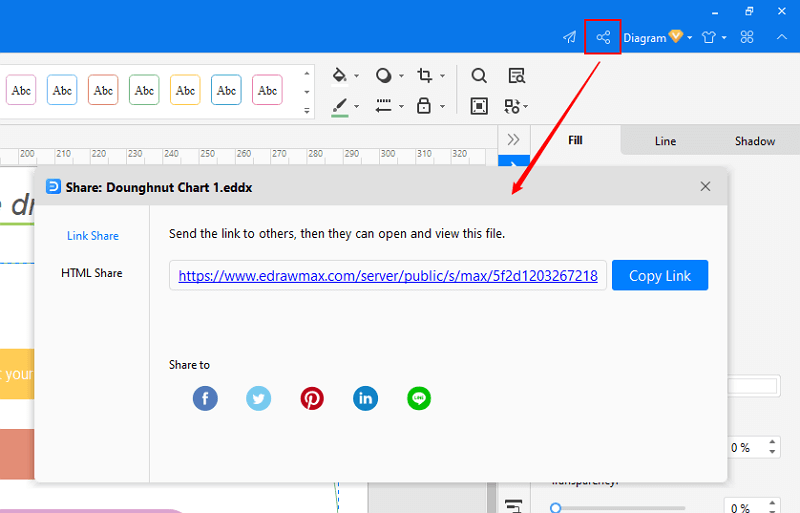
Step 4: You can also share your doughnut chart with others via social media or sharing links. In addition, you can publish your chart into EdrawMax's online template gallery.
EdrawMax
All-in-One Diagram Software
- Superior file compatibility: Import and export drawings to various file formats, such as Visio
- Cross-platform supported (Windows, Mac, Linux, Web)
Part 4: Doughnut Chart Examples
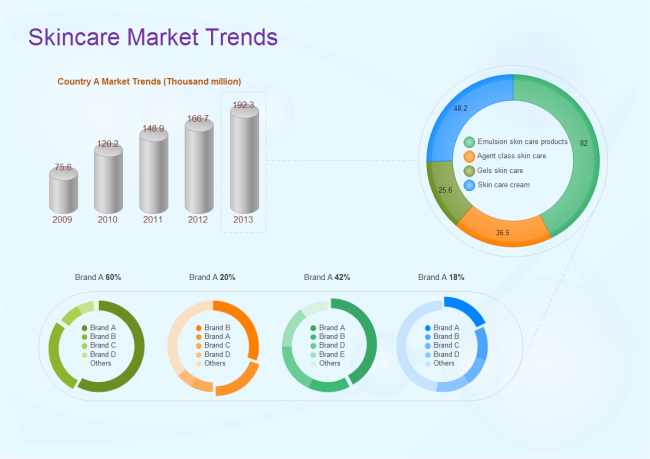
Example 1: Skincare Market Trends
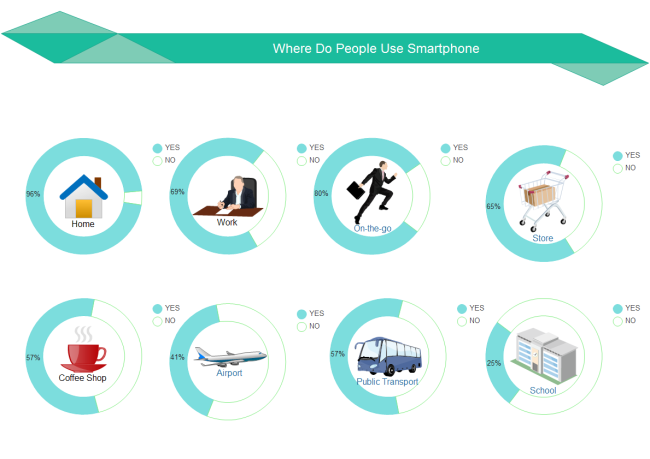
Example 2: Smartphone Use Doughnut
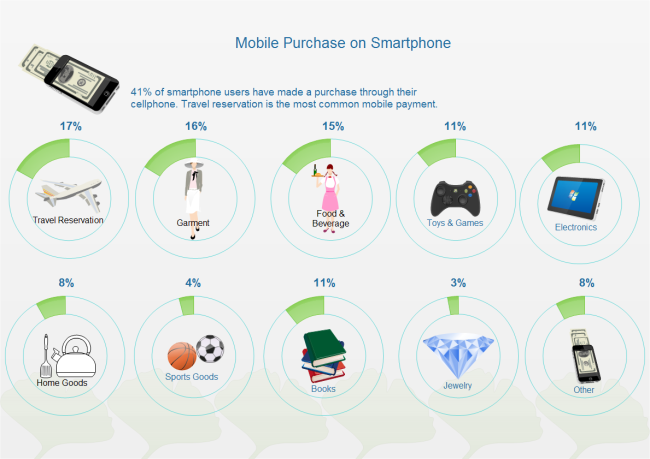
Example 3: Mobile Purchase Doughnut
More Related

