How to Make a Circular Diagram
Part 1: What is Circular Diagram?
Circular diagrams can be split into segments, each one representing a data value or a set of information. If representing a data value, the segments can be sized according to how large or small the data value is.
The key benefit of circular diagrams lies in its usage: it is extremely versatile. Circular diagrams can be used in economics to show the relationship between households, firms and markets in an economy. In mathematics, data can be shown as percentages. A different type of circular diagram is an onion diagram, which shows how different parts of a process or organization depend on each other.
Part 2: How to Make Circular Diagram?
Step 1: Start EdrawMax.
Step 2: Navigate to [New]>[Basic Diagram]>[Circular Diagram]
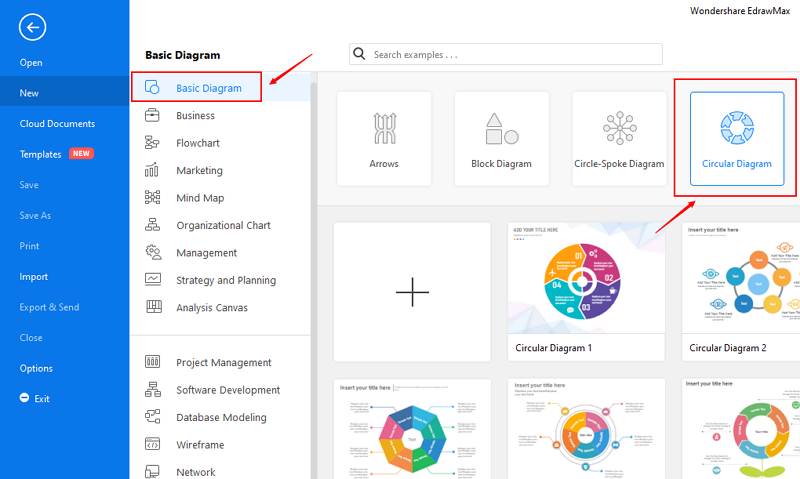
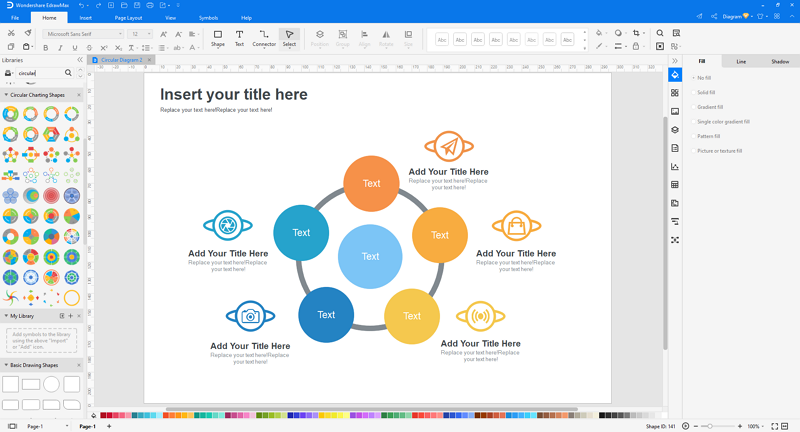
Step 3: Select one circular diagram template to edit on it or click the [+] sign to start from scratch.
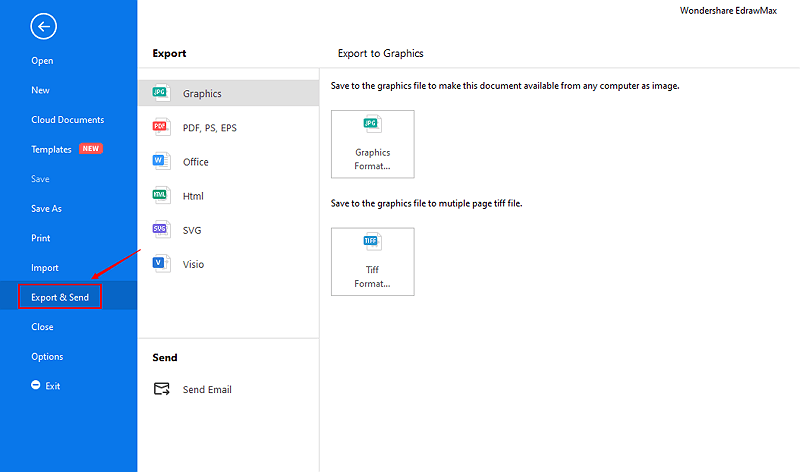
Step 4: You can export the file to Graphics, PDF, editable MS Office file, SVG and Visio vsdx file.
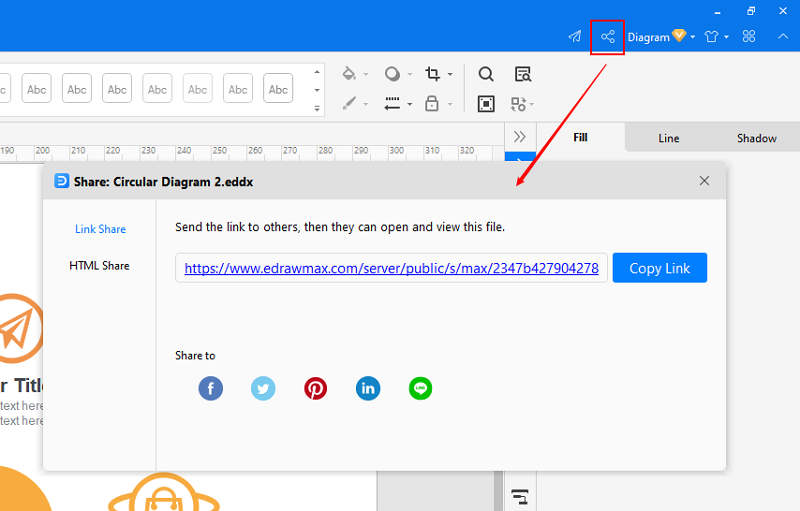
Step 5: And you can share your diagram with others via social media and web page.
Watch the video to learn how to create a Circular diagram.
If you have trouble in watching the video tutorial, please visit it at YouTube.
Part 3: Circular Diagram Examples
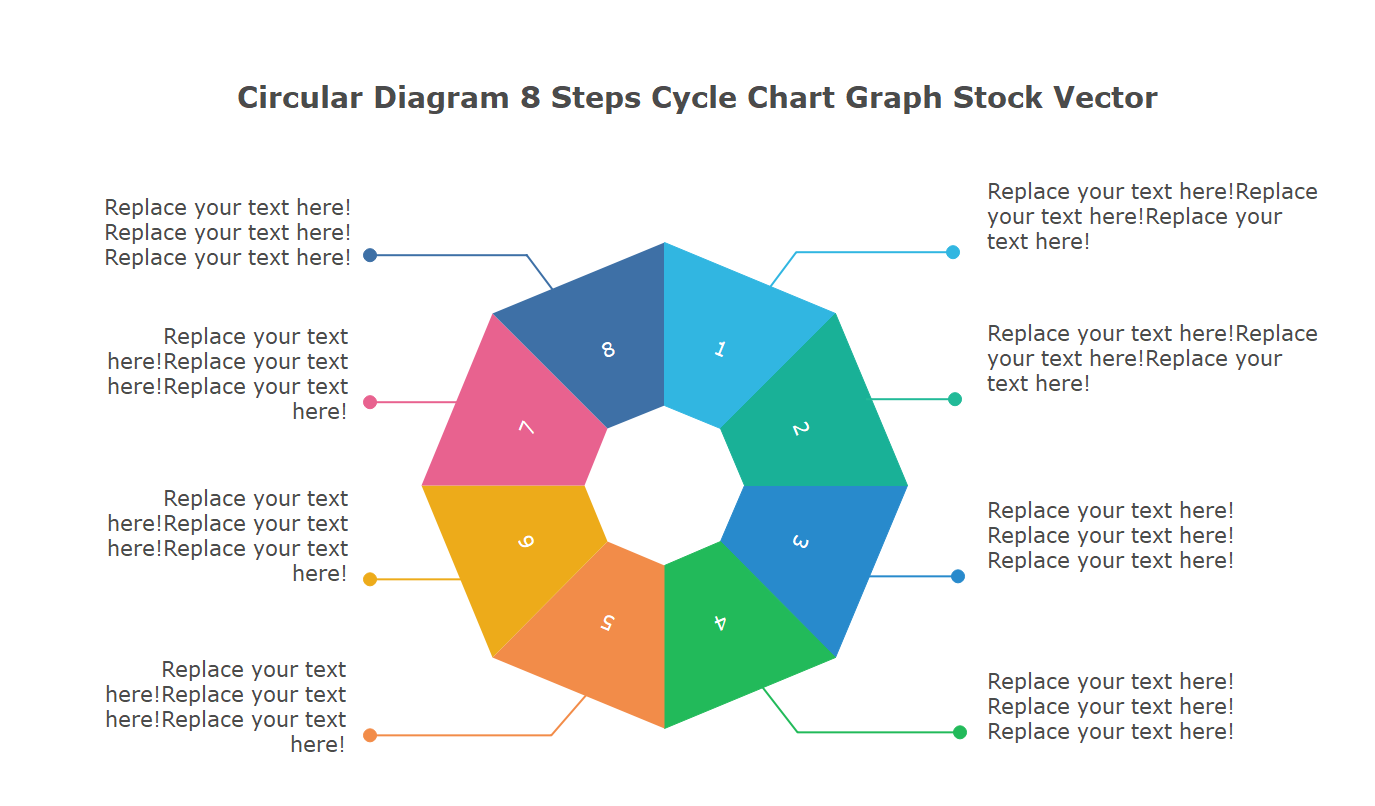
Example 1: Circular Diagram 8 Steps Cycle Chart Graph Stock Vector
The eight steps circular diagram shows the graph stock vector for complex business presentations. Business process development shows are common to incorporate business zones. The 8-steps circular diagram is a generic diagram with rich designs.
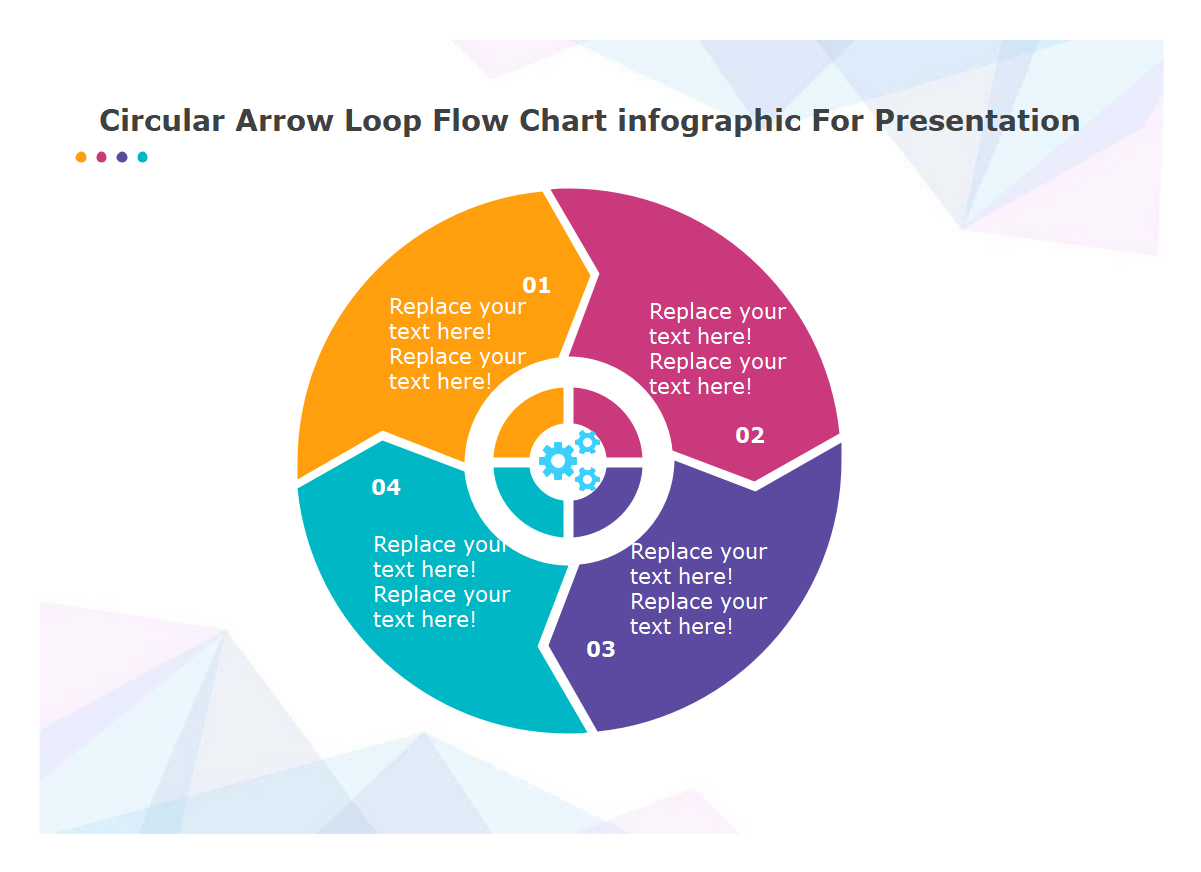
Example 2: Circular Arrow Loop Flow Chart infographic For Presentation
A circular diagram is a graphical representation used in various sectors to represent financial transactions or present a company’s infographic. One circular arrow loop shows the flow of physical things and even depicts the money flow at different stages.
More Related
Vector Circular Diagram Templates - Free, Editable and Printable
A Shortcut to Construct Circular Diagram
How to Create a Multi-Level Circular Chart
Circular Arrow Diagram - Free Circular Arrow Diagram Examples and Templates Download

