Column Chart Software
Introduction
Still do large amounts of manual work and endless adjustments of graphical elements to create column charts? We agree that the data speak louder than words. But we never accept to spend large amount of time. So it is time for you to speed up. Otherwise, you will not be able to catch up your competitors.
Overview of Column Chart
A column chart is a graphical representation of data with bars of lengths regularly proportional to the magnitudes or frequencies of what it signifies. Column charts are useful for showing data changes over a period of time or for illustrating comparisons among items. Column charts display vertical bars going across the chart horizontally, with the values axis being displayed on the left side of the chart. With column chart, you can immediately see a gentle increase of users without reading any data. You can choose the column chart to represent a variety of different charts including simple columns, clustered columns, stacked, 100% stacked, and high/low.
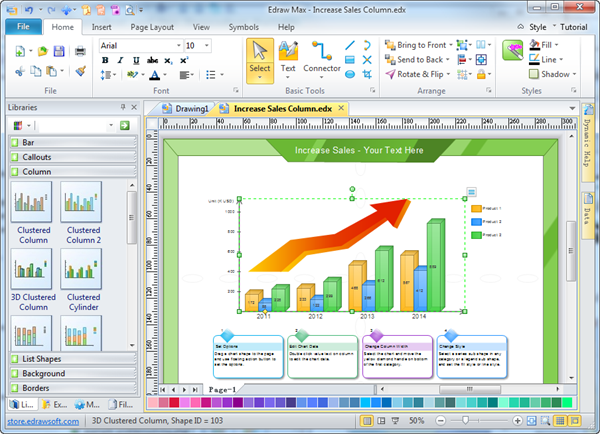
Automatic Column Chart Software
Try Edraw column chart software to keep one step ahead or more. It integrates frequently used graphical elements, automatic distribution of labels and various types of charts. Our awesome community integrates with relentless pursuit of perfection so that you can communicate with maximized impact. Making data-driven charts is no longer painstaking and difficult but easy and fun with our software. If you don't believe, you will never know what you can achieve. So check it out.
Discover why Edraw is an awesome chart maker: Try it FREE.
Video Tutorial - How to Create a Column Chart
System Requirements
Works on Windows 7, 8, 10, XP, Vista and Citrix
Works on 32 and 64 bit Windows
Works on Mac OS X 10.2 or later
Extra Strong Features for Designing Column Charts
- Seamless integration with MS Office application;
- 1-click manipulation;
- Floating action button to set the chart options;
- Yellow diamond handles on bottom to change the interval;
- Quick access to fonts, colors, fills, line styles & number formats;
- Stacked, clustered column, 100% column and 3D stacked column;
-
Auto-layout labels for segments, series & categories.
It Works at the Following Column Graphs
It is easy to design simple column graph, clustered column, 3d clustered column, stacked column, 3d stacked column, stacked cylinder, 100% stacked column, 3d 100% stacked column, single column graph and more.

Column chart shows data changes over a period of time or illustrates comparisons among items.
Clustered column compares values between different categories.
3D clustered column is available with a 3-D visual effect.
Cylinder column is available with a cylinder style in the column.
Stacked column shows the relationship of individual items to the whole, comparing the contribution of each category's value to a total.
3D stacked column is available with a 3-D visual effect.
100% stacked column compares the percentage that each category's value contributes to a total.
3D 100% stacked column is available with a 3-D visual effect.
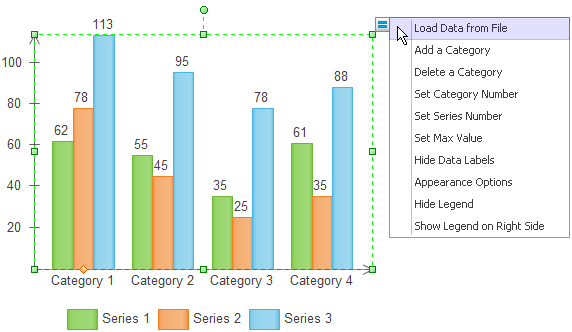
Point and Click Editor of the Smart Symbols
All of Edraw's column chart symbols are smart shapes that know what to do according to users' order. They are attached with floating buttons that support point and click editing of shapes. Select the shape and the smart editor will appear immediately. See the following illustration.
Column Chart Examples
Column Chart Example
This nice-looking column chart example is well prepared to benefit our users. You can have a quick start using this vector file as a template.
Column Chart Example - Sales Growth
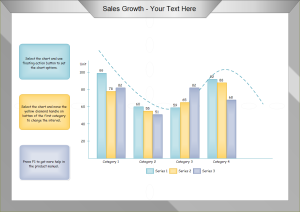
Another column chart example is shown to inspire more graph designers.
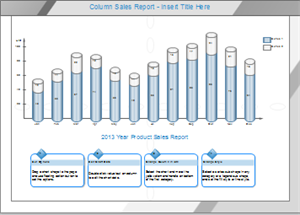
Column Chart Example - 100% Stacked Column
We prepared this vector bar chart template for you to view and apply.

