Cause and Effect Diagrams for Problem Solving
Cause and effect Diagrams for Problem Solving
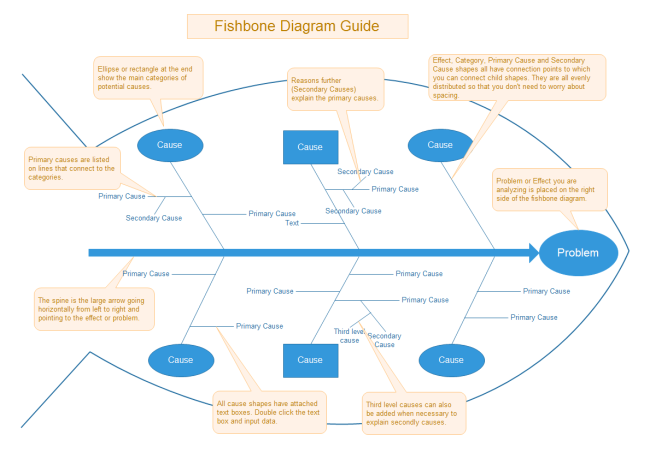
Edraw contains powerful tools for problem solving with fishbone diagram graphic method. Fishbone diagram can be grouped into major categories to identify sources of variation causes. Fishbone diagram shows factors of Equipment, Process, People, Materials, Environment and Management, all affecting the overall problem in one drawing for the further analysis. Typically, a cause and effect diagram is composed of problem (effect), spine, category, primary cause and secondly cause. These elements are illustrated like fishbone and thus called fishbone diagram. Below is a detailed guide about Edraw fishbone diagram. Click the picture to download it.
Fishbone Diagram Template - Problem solving
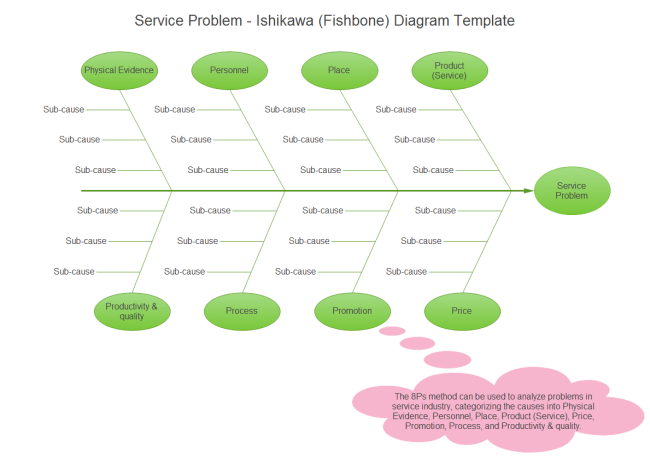
From the template, we can see that fishbone diagram can help analyzers find out as many causes as possible. And it clearly displays the logical relationship between cause and sub cause until the root cause is found out. Generally, eliminating the root cause is often the solution for a problem.
Edraw Fishbone diagram solution is vector graphics and diagramming software with the ability to solve problems using the cause-and-effect diagrams. With Edraw, you can gain more visual tools to aid problem solving like reframing matrix, radar chart and mind map.
Use Edraw enhanced with Fishbone diagram solution to draw your own Ishikawa diagrams for problem solving, in only a few minutes.
Discover why Edraw is an excellent program to create cause and effect diagram. Try Edraw FREE.
Lost Customer Analysis Fishbone Diagram
5W1H Method for Cause-effect Analysis

