Basic Spider Chart Knowledge
Spider chart, also called radar chart, star chart, web chart, etc., provides a view of data comparing the client company's performance to that of its competitors' various areas, illustrating strengths and weaknesses. To help you to know better about spider chart, we will introduce some basic spider chart via a simple spider chart example.
Video Tutorial - Create a Spider Chart
Brief History of Spider Chart
Typically, spider charts are generated in a multi-plot format with many stars on each page and each star representing one observation. The star plot was first used by Georg von Mayr in 1877. Spider charts differ from glyph plots in that all variables are used to construct the plotted star figure. There is no separation into foreground and background variables. Instead, the star-shaped figures are usually arranged in a rectangular array on the page.
Example of Simple Spider Chart
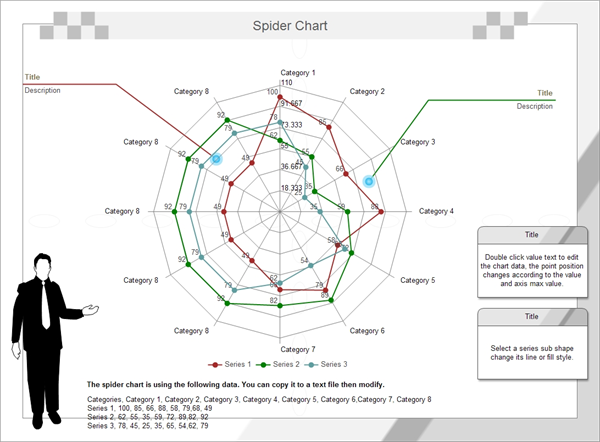
Many people may still be confused after seeing many spider chart examples. No worries, we will show you how to read the spider chart. The picture below is the simple spider chart drawn via spider chart maker.
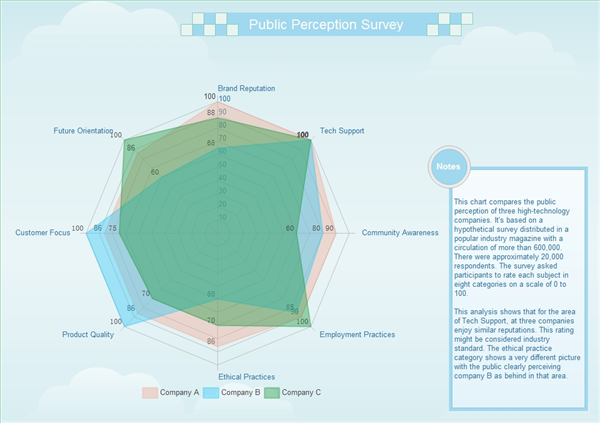
This spider chart above compares the public perception of three high-technology companies. It's based on a hypothetical survey distributed in a popular industry magazine with a circulation of more than 600,000. There were approximately 20,000 respondents. The survey asked participants to rate each subject in eight categories on a scale of 0 to 100.
This analysis shows that for the area of Tech Support, at three companies enjoy similar reputations. This rating might be considered industry standard. The ethical practice category shows a very different picture with the public clearly perceiving company B as behind in that area. You may also find that company B achieves the highest product quality.
Steps to Draw the Simple Spider Chart
When people first see the spider chart, many of them might think that spider chart is different to draw, especially by hand. Infact, if you choose our software, drawing spider chart is quite an easy job.
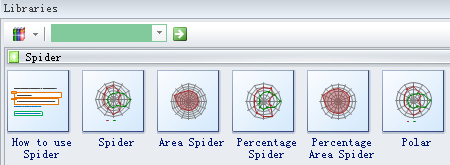
First, select a spider shape (Area Spider) you like in the libray which is on the left canvas.
Drag and drop the spider shape you have chosen. Move the mouse and find the floating button on the upper right of the diagram. Choose the option "Load Data from File" to load your data. Then you may set the series number(3), axis number(8), ring number(10), max value(100), etc.
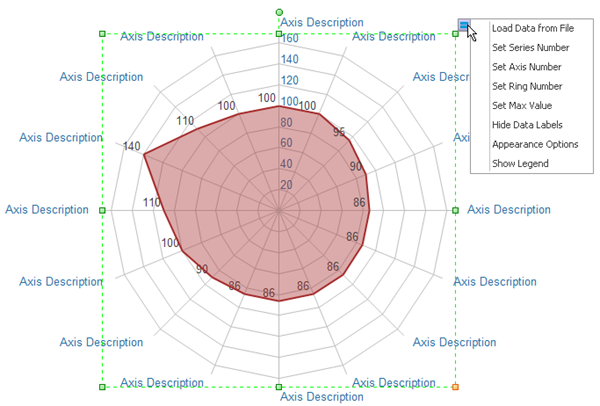
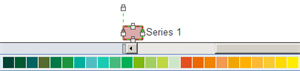
Choose the option "Show Legend" from the floating button. Then select the legend, and choose the colors you like for series.
Modify "Axis Description" by double click it.
Finally you may add the background, titles, callouts, etc., to the diagram to make it look more attractive.
We believe that you soon can draw your own spider chart after you read this passage and More Spider Chart Templates, Spider Chart Examples Symbols, Create a Spider Chart.

